Technical Architecture
Rainbond Technical Architecture

Rainbond adheres to the application-centric philosophy, incorporating excellent community solutions to form a logical technical architecture of the data center that combines three major modules: application control, application runtime, and cluster control. Together with the physical architecture categorized by node types such as management nodes, compute nodes, gateway nodes, and storage nodes, it forms a highly available and scalable data center architecture system.
Above the data center architecture, it is divided into application management control terminals and resource management control terminals based on the target user groups, serving application development and operation maintainers and resource users respectively.Supporting users to manage and control multiple data centers simultaneously in a multi-data center mode.
Data Center Service Components Description
Data Center API Service
As the core control service of the data center level abstraction, the API service provides Restful-style API services externally and is the sole entry point for data center control requests, with security control based on TLS mutual security authentication.After self-signing certificates, distribute them to the client.

After API service requests enter, they are distributed by the router module. Ordinary requests enter the Handle request processing module, which mainly handles requests for operating database models. The API service supports MySQL database and CockroachDB database based on ORM.Requests entering the Proxy are divided into API requests and Websocket requests.The Discover module finds its proxy target through etcd service and forwards the request.Therefore, APIs provided by other components can have their requests forwarded by the API service proxy through service registration.
Application Gateway Service
The application gateway is the sole entry point for external traffic to enter the internal components of Rainbond tenants, providing HTTP, HTTPS routing, TCP/UDP services, load balancer, advanced routing (A/B testing, canary release), virtual IP support, and other functions.
The design inspiration for the application gateway comes from NGINX Ingress Controller, based on converting the Kubernetes resources (Ingress, Service, Secret, Endpoint) models monitored from kube-apiserver into configurations for the Proxy controller, providing an automatically working, real-time effective, dynamically hot-configured 7-layer, 4-layer gateway service.
The application gateway can increase concurrent capabilities and basic performance through horizontal scaling, with universal configurations taking effect synchronously across all gateway nodes.For 74IP+
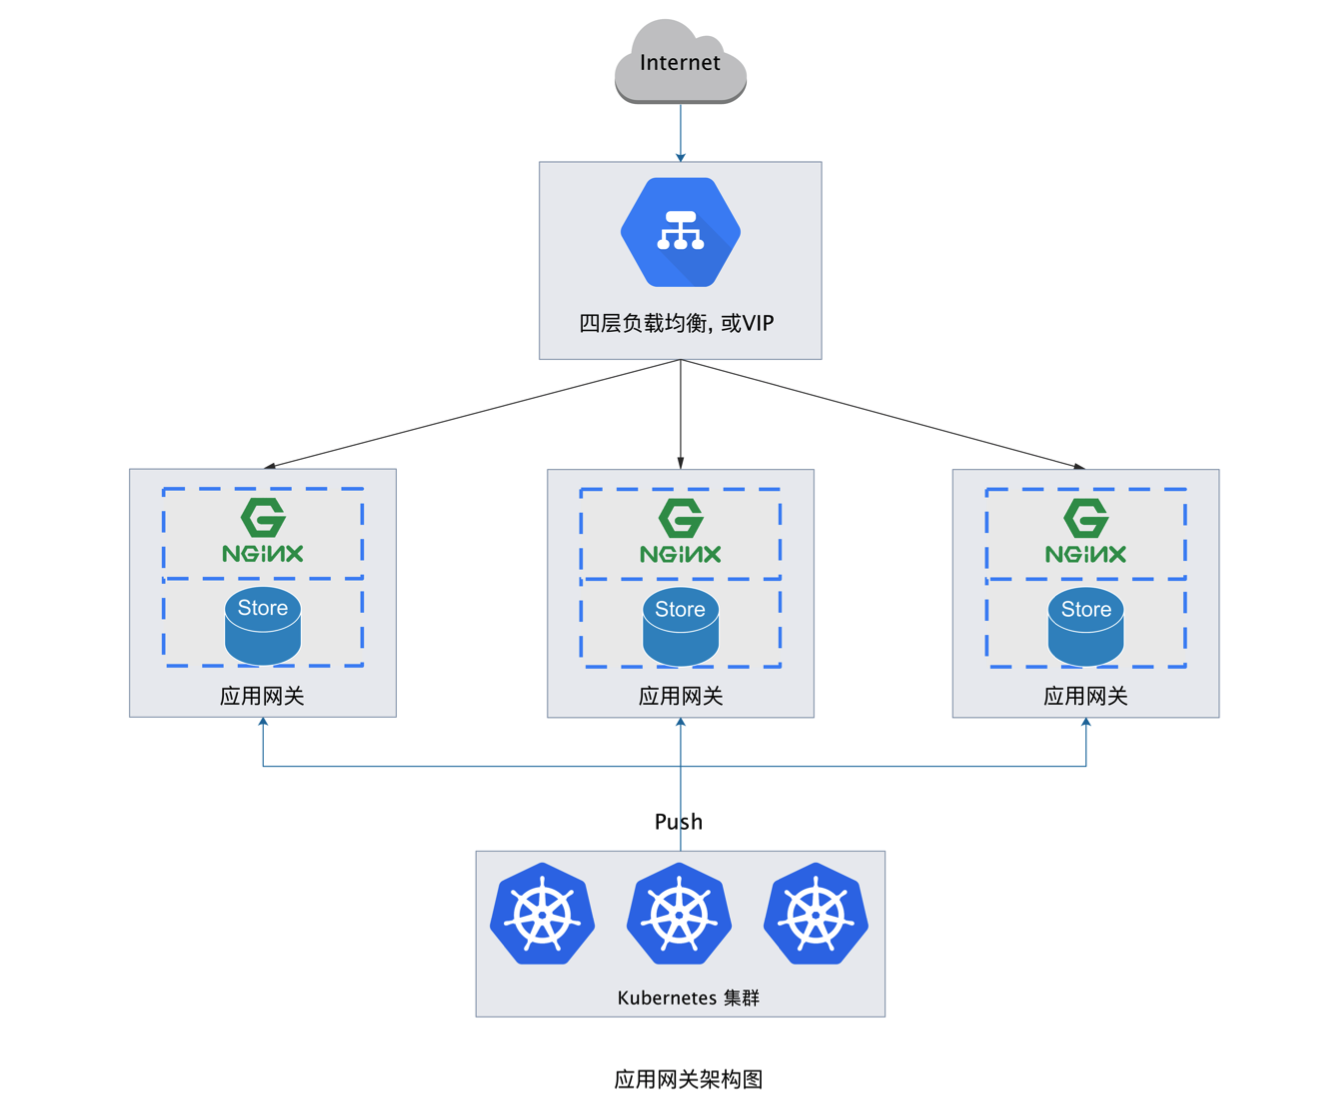
The architectural goal of the single-node application gateway service is to support multiple data sources, multiple IPs, high concurrency capability, multi-Server capability, and dynamic configuration change capability.Based on this, the application gateway architecture design is as follows:

The application gateway service integrates Openresty service as the front-end traffic proxy service, extends Openresty functionality based on lua, Lua-Config-Controller implements dynamic configuration, Upstream management, load balancing strategy for Openresty, Lua-Monitor-Controller implements recording and summary reporting of request data, Lua-Security-Controller implements security control of requests.The three Lua modules are driven by Openresty-Controller to work, the Metric-Controller module aggregates various monitoring data of the gateway and exposes a Prometheus-compliant Metric-Server externally.Openresty-Controller is data-driven, with data sourced from Gateway-Model-Controller, the two layers are decoupled, implementing standard interface specifications.As needed, we can implement drivers based on other proxy services, such as F5.
The data model source of the application gateway supports the ingress model of kubernetes or discovers a simplified model from etcd, driven by data discovery service to make the entire gateway work dynamically.IP is an important resource of the gateway, the IP-Port-Pool module will acquire all available IP addresses and ports of the current cluster after startup and establish awareness of IP address changes, the IP-Manage module will determine whether the gateway strategy takes effect on the current node based on IP and port data.
Application Build Service
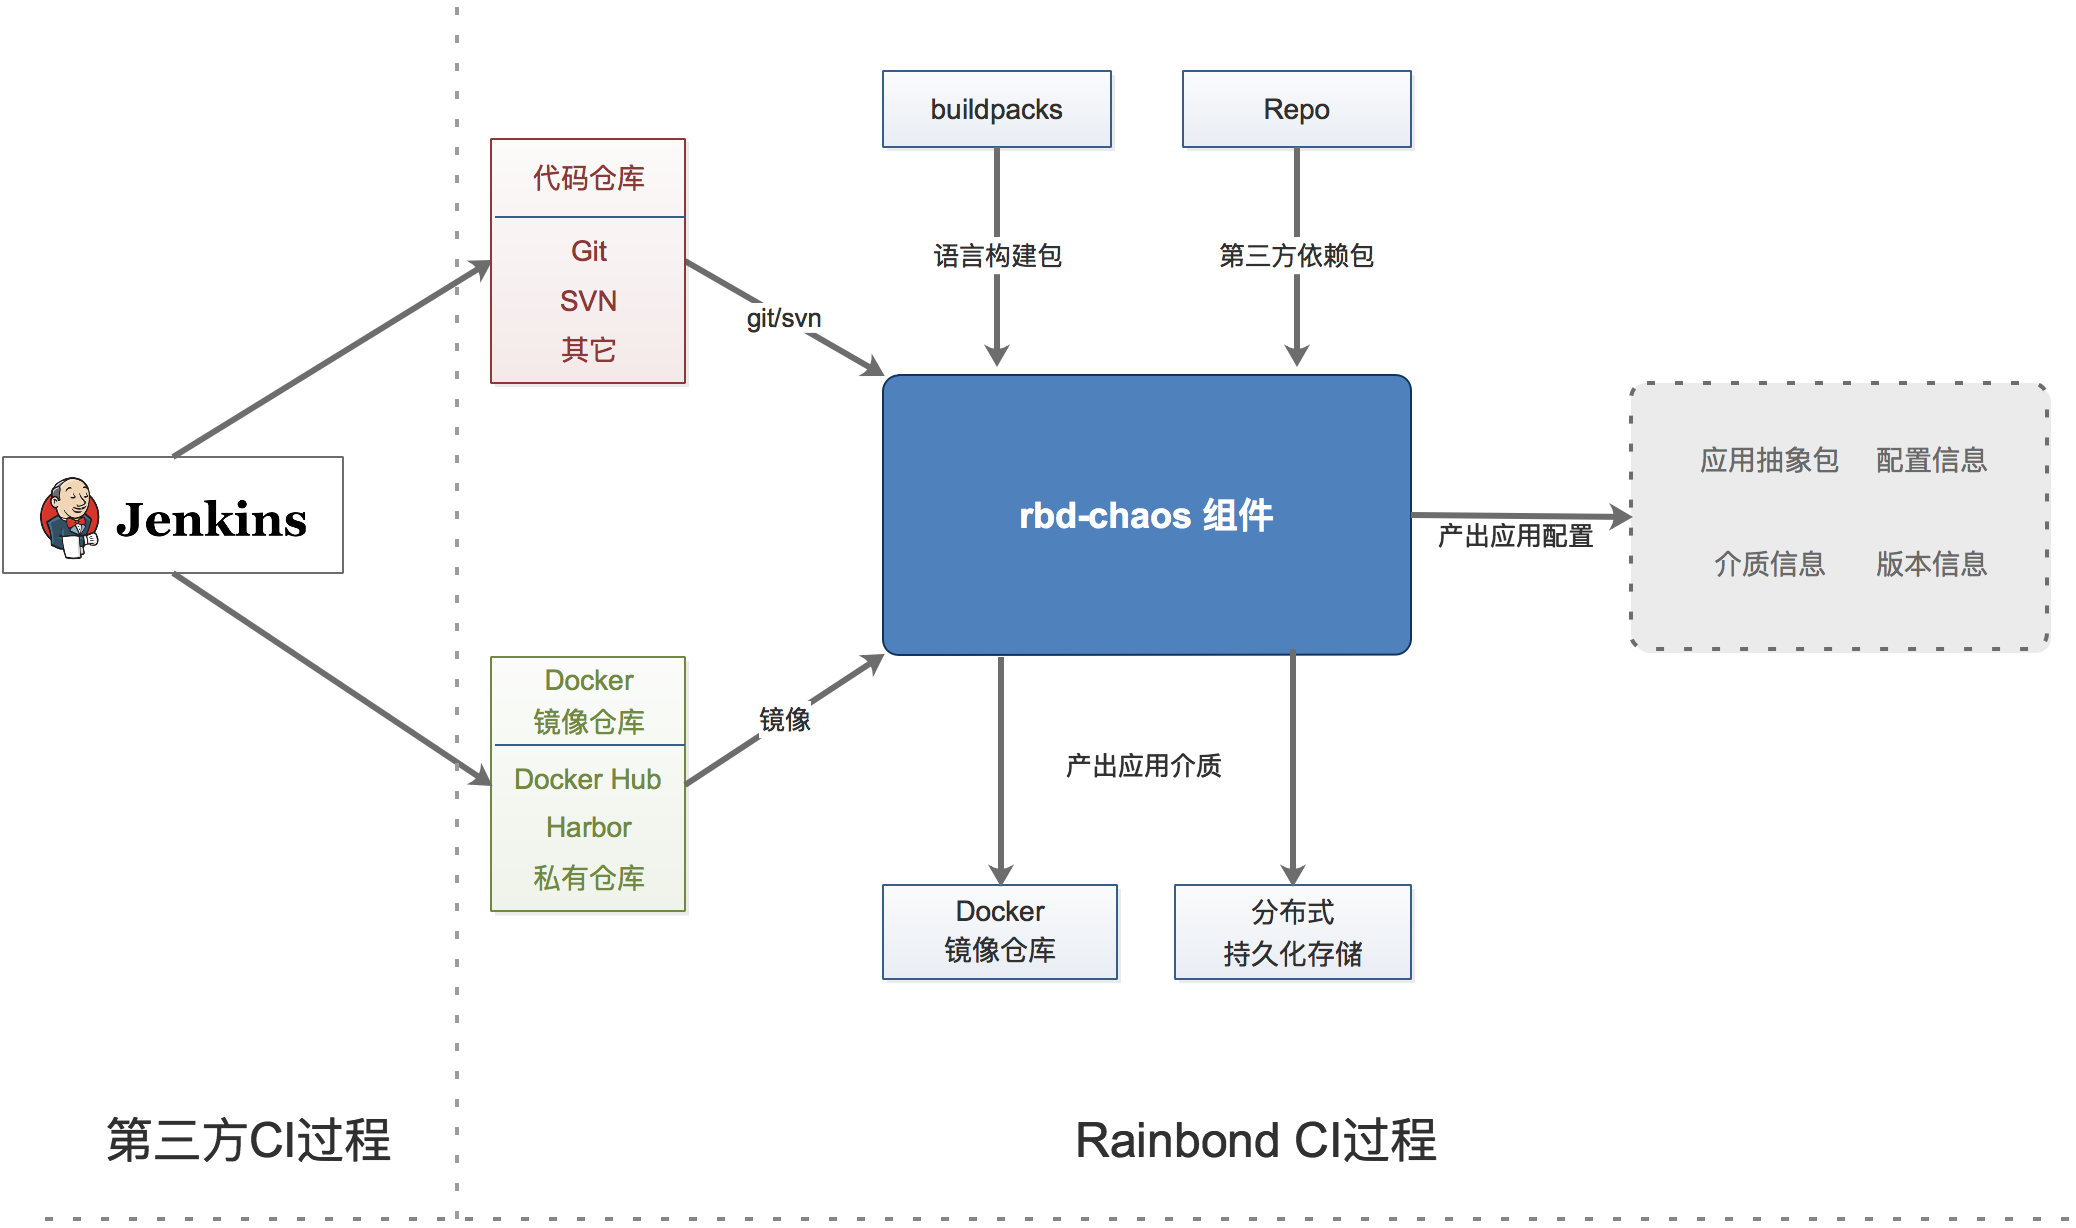
Rainbond application build service handles the CI process, parsing, compiling, and packaging input sources including source code or Docker image or application market application, ultimately generating version media for the application (component).
Traditionally, the complete CI process includes: design, coding, packaging, testing, and release. Since its introduction, Docker images have gradually become a new form of packaging for many application codes.Existing CI products have already done very well in source code testing and Pipeline, such as Jenkins, Gitlab, etc. Therefore, Rainbond can directly connect to third-party services for the pre-processing of source code or Docker images, with the source code or images processed by third-party services then connected to the Rainbond-Chaos module for application abstraction.
The input sources of Chaos support code repositories with Git, Svn protocols, and Docker image repositories.If it is source code, Chaos intelligently determines the type of source code, such as Java, PHP, Python, Dockerfile, etc., selects the corresponding BuildingPack (source code builder) for source code compilation according to different source code types, and identifies the runtime environment requirement parameters, application ports, environment variables and other parameters defined in the source code, forming the configuration prototype of the application abstraction.Source code types other than Dockerfile will be compiled into application code environment packages (SLUG) stored in distributed storage, others generate Docker local images stored in the data center image repository, forming application component attributes combined with various attribute information of the application.
The application build service is a stateless architecture, designed as a task executor driven by the message system (rbd-mq). Implemented Git client and image repository client, integrated SVN client to obtain component build source resources. The task execution process records complete logs, which are input to the rbd-event-log service by the event client through the message stream.Each source code build process is controlled by Chaos to call the local Docker API to create a build container and maintain the container lifecycle.
The source code build process is a very resource-consuming process, so the application build service supports multi-node deployment to increase the number of concurrent build tasks supported, with the maximum number of concurrent builds supported by each node determined by the node's CPU cores or manually set by the operation and maintenance personnel.
- For source code compilation BuildingPack reference Language Support Documentation.
- The application build service supports multi-point high-availability deployment, with multi-point deployment obtaining application build tasks from the message middleware.
Application Runtime Control Service
The application runtime control service instantiates the Rainbond-Application Model into Kubernetes resource models, allocates various resources required for application operation, completes the operational part of the application lifecycle, which can be understood as the CD control service. The design focus of this service is to support the lifecycle supervision of a large number of applications.

The application lifecycle may experience starts, stops, upgrades, and rollbacks.Different application types require different control strategies, for example, stateless applications can perform unordered rolling upgrades, while the upgrade control strategy for stateful applications will be more complex.The Worker service implements lifecycle controllers for various component types, including startup, shutdown, update, scaling, etc.
Application operation requires various external environment supports, such as allocating tenant IP, port and other network resources, allocating persistent storage resources according to application settings, such as shared file storage allocating storage directories, block storage, etc., relying on various plugins to allocate storage resources. Establish service discovery and load balancing strategies based on application dependency properties to supply mesh plugins.Generate scheduling strategies based on application attributes to call Kubernetes cluster to schedule application operation.
Currently, Rainbond uses the following Kubernetes resource types: Deployment, Statefulset, Service, Ingress, Secret, ConfigMap, Pod.For users, there is no need to understand these resources, nor are they reflected in the product, they are just carriers for application operation.
The Worker component functions are divided into stateful and stateless parts. To achieve cluster deployment of worker components, worker performs master node election, and the service elected as the master node will provide application storage Provider and storage statistics services.
The Worker component is a module for kubernetes-controller controller extension and scheduler extension, currently implementing local storage Provider, stateful component shared storage Provider, etc., and it also obtains existing resources in the Kubernetes cluster for Rainbond application components to choose to use.
The Worker component supports multi-node deployment to ensure high availability.
Monitoring service
The design goal of the Rainbond cluster monitoring service is to comprehensively monitor four dimensions: application business performance level, application container resource level, cluster node level, and management service level. Functionally, it provides data storage, query, visualization, and alarm. Performance-wise, it supports large-scale clusters.
Rainbond encapsulates the Monitor component based on Prometheus, automatically discovers various monitoring objects such as applications, clusters, and cluster node services from etcd and Kubernetes clusters, completes Prometheus monitoring target configuration, and includes the monitoring targets in the Prometheus monitoring scope.Each component of Rainbond also implements the exporter side of Prometheus to expose monitoring metrics.Achieve automated monitoring of multiple dimensions without user intervention.
The Monitor component can automatically configure some default alarm rules. It plans to support obtaining custom alarm rule resources from Kubernetes to generate Prometheus alarm rules for dynamic effect, thereby supporting custom alarm rules. Alarm information is processed by the third-party Alter-Manage system.
By default, Prometheus does not support cluster deployment and cannot directly improve monitoring capabilities by expanding nodes.To enhance the processing capability of the monitoring system, it currently supports improving data storage capability through remote storage; supports configuring synchronization across multiple nodes to provide service availability; supports adjusting the monitoring data storage window and reducing memory resource usage.Plans to support clustering partitions for monitoring targets, thereby supporting node expansion to enhance monitoring capabilities, providing a unified query API to shield the underlying data partitions.
Message middleware service
The MQ component is a lightweight distributed, message persistent, and globally consistent message middleware implemented based on Etcd.This component maintains asynchronous task messages and provides multi-topic message publishing and subscription capabilities.
There are many message middleware products on the market, such as ActiveMQ, RabbitMQ, ZeroMQ, etc. For our needs: distributed, persistent, globally consistent, lightweight, ordered, and other key attributes, the existing message middleware products more or less do not meet.
Etcd is a simple, secure, fast, and reliable key-value storage service, playing an important role in our entire system architecture.It is very convenient to implement a basic message system based on the existing features of etcd.For each subscription topic, a key is used, controlled by etcd for timing and exclusive mechanism, so that incoming messages can be consumed in order. Clients can subscribe to messages very simply through the watch mechanism provided by etcd.Based on this, we have packaged two types of APIs: restful and grpc.Clients can conveniently operate the PUB/SUB of messages.
Event and log processing service
The logs and message information that the Rainbond platform needs to process include three major categories: user asynchronous operation logs, application build logs, and application runtime logs.
User asynchronous operation logs: For user operation logs, we need to distributedly track the final status of each operation. Currently, the eventlog component determines the final status of the operation based on the log aggregation of each operation.Other components will send process log records to the eventlog cluster through gRPC message streams during the processing of an asynchronous task.
Application build logs: Mainly display the output information of source code build or Docker image build, which comes from the application build service.
Application runtime logs, currently we divide them into two forms:
(1) Standard output/error output logs
For standard output logs, the computing node log collector obtains the log stream through Docker Daemon for business separation, and by default, based on TCP data stream communication, sends all container logs from computing nodes to the Eventlog component in real time for application-level aggregation, thereby storing and pushing to the UI in real time. In future versions, the log collector will implement docking with third-party log systems to directly send logs to third-party log processing platforms.
(2) Business logs (access logs) output to persistent files
For business logs output to persistent directories, they generally need to be automatically analyzed, such as docking with the ELK system. Therefore, install log processing plugins in the plugin system to collect log files from persistent directories and send them to third-party log analysis services.
The design requirements for cluster log processing are to support log aggregation, storage, real-time push, and query.And it can support a large amount of logs.
According to the above log type analysis, operation logs are limited log streams, and their main requirement is to achieve storage and implement push to clients.The processing chain for such logs mainly involves receiving logs sent by various component clients through gRPC message streams, aggregating and storing logs by event, and simultaneously spreading them in the cluster, thereby providing distributed log subscription capabilities to clients.Achieve the effect of single-node storage and multi-node readability.
Application runtime logs are unlimited log streams, with multiple log sources, determined by the number of applications existing in the current cluster and the amount of logs generated by each application.Therefore, to support the huge amount of application logs, the eventlog service implements partitioned log processing capabilities, flexibly adjusting the log processing nodes by component (service_id). The runtime logs of the same component are sent by the log collection service of each computing node to the designated eventlog service node through TCP message streams. After receiving the logs, the eventlog service aggregates, buffers, and stores them.At the same time, it provides real-time push capabilities to subscribing clients.When clients subscribe, the rbd-api service loads to the designated eventlog service node based on the subscribed service_id information.
Eventlog service cluster nodes need to communicate with each other, including sharing operation log streams and reporting processing capabilities to decide the processing nodes for application runtime logs.Therefore, Eventlog service nodes communicate through ZeroMQ subscription mode. ZeroMQ is a high-performance messaging library, ensuring the communication performance between Eventlog services.When processing logs, Eventlog worker nodes fully utilize the memory buffering mechanism to improve the throughput rate of log messages while reducing the pressure on the disk.
The Eventlog service is a stateful cluster service that supports horizontal scaling to improve the processing capability of application logs.
Cluster and node management service
The Node component is the basic service for forming the Rainbond cluster, and all nodes in the cluster need to run this component.It provides key capabilities such as node information collection, cluster service maintenance, application log collection, and application runtime support.
The Node component has two roles: master role and worker role.Generally, the Node running on the management node has the master role. The master role maintains the status and information aggregation of all nodes and provides API query services. Worker role nodes regularly report their status to the master node.
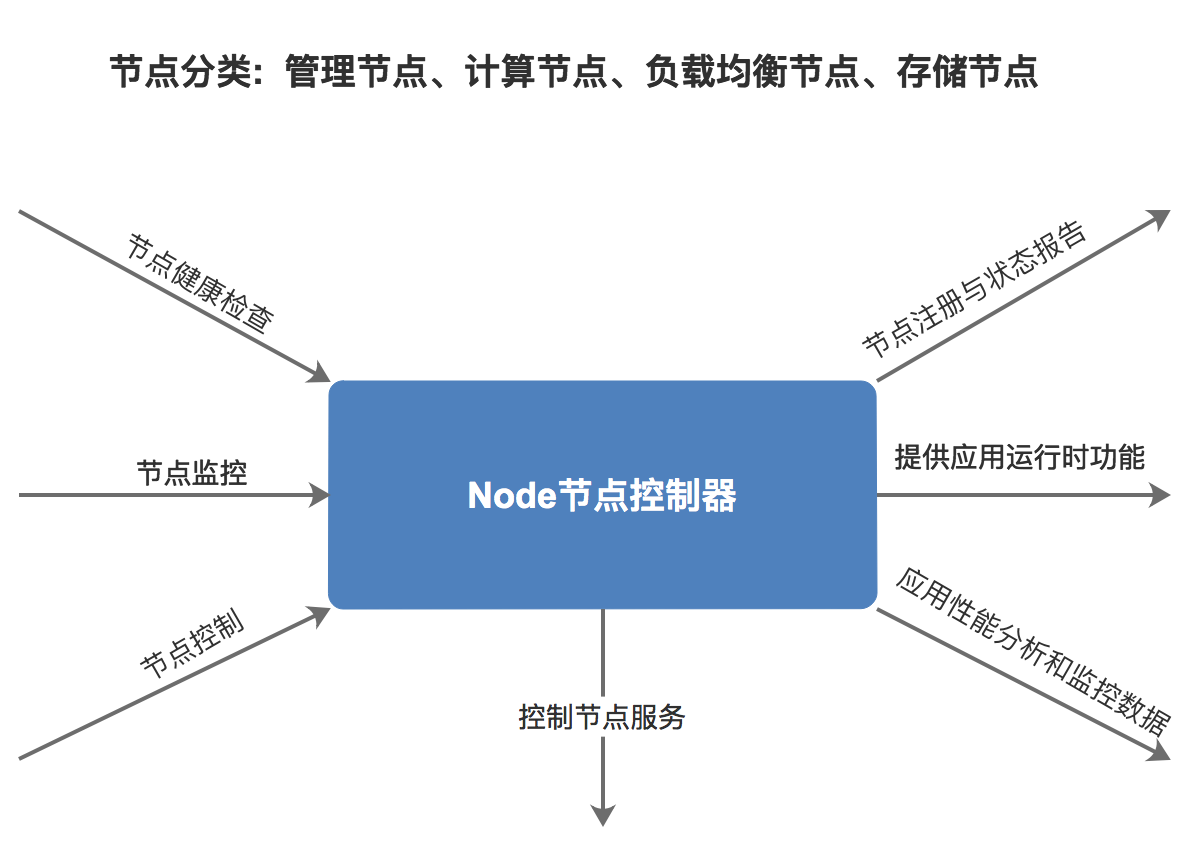
The node controller first acts as the guardian task for the services running on the current node, similar to Kubelet in this regard.Each node needs to run services or health check items, defined in yaml format in the /opt/rainbond/conf directory.After startup, the controller will read the configuration in this directory. For services that need to be started, it will call the systemd daemon to start the service. For health check items, it will generate health check controllers according to the configuration.The design here is mainly to achieve automated cluster operation and maintenance and expand the monitoring items of Kubernetes nodes.The node controller will maintain the status of all configuration items and report them to the master node.For abnormal services, the controller will try to restart and recover the service according to the rules. If recovery is not possible, it will suggest the master node to set the current node to an unhealthy state and remove it from the available scheduling scope until the node recovers.
In terms of monitoring, Node exposes various monitoring indicators at the operating system and hardware level (integrated prometheus node-exporter), and acts as a collector for application performance analysis data, transforming and exposing application performance analysis indicators.All exposed monitoring indicators are collected by the rbd-monitor service.
The Node service running on all computing nodes establishes the runtime environment support for applications running within the tenant network, especially the support for ServiceMesh and dynamic configuration query of plugins.The Node service provides universal configuration discovery API and service discovery API to support the application architecture running on the current node. On this basis, it offers XDS Server service to provide dynamic configuration for the built-in ServiceMesh architecture.

The node controller log collection module implements the collection of runtime logs for all application containers on the current node.By obtaining the container list and log driver configuration from Dockerd in real-time, it generates a log copyer driver for each container. The log copyer driver has multiple implementations, with the default being to transmit logs to the eventlog service.It also supports drivers for other log collection services, such as ES.
Application Web Terminal Control Service
This component implements the function of connecting to the container console via the web.This component communicates with the UI through WebSocket, allowing users to send various shell commands via a simulated web terminal. The webcli executes commands in the container through the exec method provided by kube-apiserver and returns the results to the web terminal.
The rbd-webcli service can intercept and sanitize all user commands.Prevent malicious command injection, achieving terminal to browser communication through a secure mode.
Metadata Storage Service
Rainbond data center metadata currently supports storage in Mysql database or CockroachDB database.The database mainly stores the basic metadata of the application model and does not record the runtime data of the application.Runtime data is mainly maintained by the Kubernetes cluster or recorded in the ETCD service.
Versions 5.1.8 and earlier support Mysql 5.6
Versions 5.1.9 and later support Mysql 5.7 8.0
Image Repository Service
Based on the open-source Distribution project, used for container image storage under the current data center.
Business Logic Layer Component Description
Application Console
As a key module of Rainbond's application-centric abstraction, the application console UI component is designed for application developers and users.Based on the Django+Ant design front-end and back-end separation architecture, it provides users with an interactive experience for application abstraction, application group abstraction, data center abstraction, and application market abstraction.It implements the complete application creation and management process, application delivery and sharing process, etc.